SANTA ANA, Calif., July 2, 2024 —Today, Veros Real Estate Solutions (Veros®), an industry leader in enterprise risk management and collateral valuation services, released its 2024 Q2 VeroFORECASTSM, projecting an average nationwide appreciation of 3.2% over the next 12 months. This represents a marginal increase from the previous quarter’s forecast of 2.9%.
VeroFORECAST evaluates home prices in over three hundred of the nation’s largest housing markets, and Veros is committed to the data science of predicting home value based on rigorous analysis of the fundamentals and interrelationships of numerous economic, housing, and geographic variables pertaining to home value.
Home price growth forecasts remain positive at 3.2%, despite conflicting housing market signals. While rising inventory provides more options for buyers compared to that in 2023, prices remain stubbornly high. This is partly due to the limited impact of the inventory increase, considering the pre-pandemic levels. Additionally, the rise in available properties might be in less desirable categories, leaving a shortage of the most sought-after homes in many markets.
On the other hand, the number of homes sold has dipped compared to last year. This is likely due to elevated mortgage rates and high home prices impacting affordability. This highlights a key market shift: increasing options for buyers, but continued pressure on affordability from high prices and interest rates. While demand has cooled slightly, a backlog of unmet demand, particularly among first-time buyers, remains a significant factor supporting price levels. Additionally, a robust job market with rising wages can further support price levels, even as mortgage rates remain elevated.
However, it is important to remember that the housing market is regional. National trends might not always translate directly to specific cities or regions. While some areas might see price stabilization or even slight decreases, others could remain very competitive with high prices.
House prices are rising fastest in the Northeast and Midwest because compared to the high prices on the West Coast and Sun Belt, these areas offer significantly more affordable housing options. This attracts first-time homebuyers and those priced out of pricier markets.
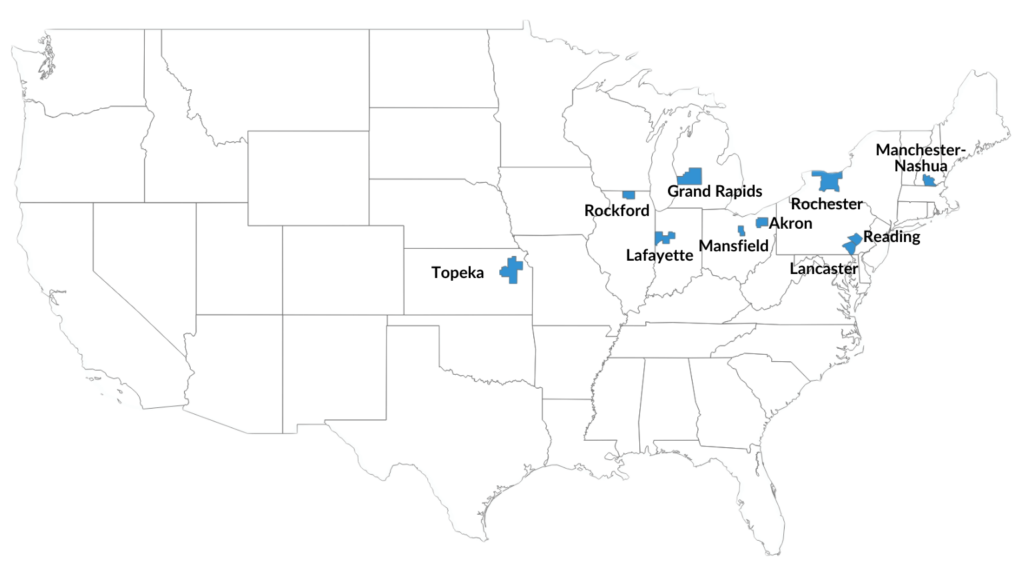
The Northeast and Midwest dominate the list of top housing markets for the next year, with projected appreciation ranging from 6.3% to 7.7%. These regions offer a blend of strong economies and relatively affordable housing, attracting buyers. Notably, two Pennsylvania cities (Lancaster, Reading), Rochester (NY), Manchester (NH), and six Midwestern metros (Akron & Mansfield, OH; Rockford, IL; Grand Rapids, MI; Topeka, KS; Lafayette, IN) lead the pack.
The 10 Strongest-Performing Markets Over Next 12 Months
| Rank | Markets |
Forecast Data Q2 2024 - Q2 2025 |
|---|---|---|
| 1 | READING, PA | 7.7% |
| 2 | ROCHESTER, NY | 7.5% |
| 3 | ROCKFORD, IL | 7.3% |
| 4 | LANCASTER, PA | 6.9% |
| 5 | LAFAYETTE-WEST LAFAYETTE, IN | 6.8% |
| 6 | MANCHESTER-NASHUA, NH | 6.6% |
| 7 | GRAND RAPIDS-WYOMING-KENTWOOD, MI | 6.4% |
| 8 | TOPEKA, KS | 6.4% |
| 9 | AKRON, OH | 6.4% |
| 10 | MANSFIELD, OH | 6.3% |
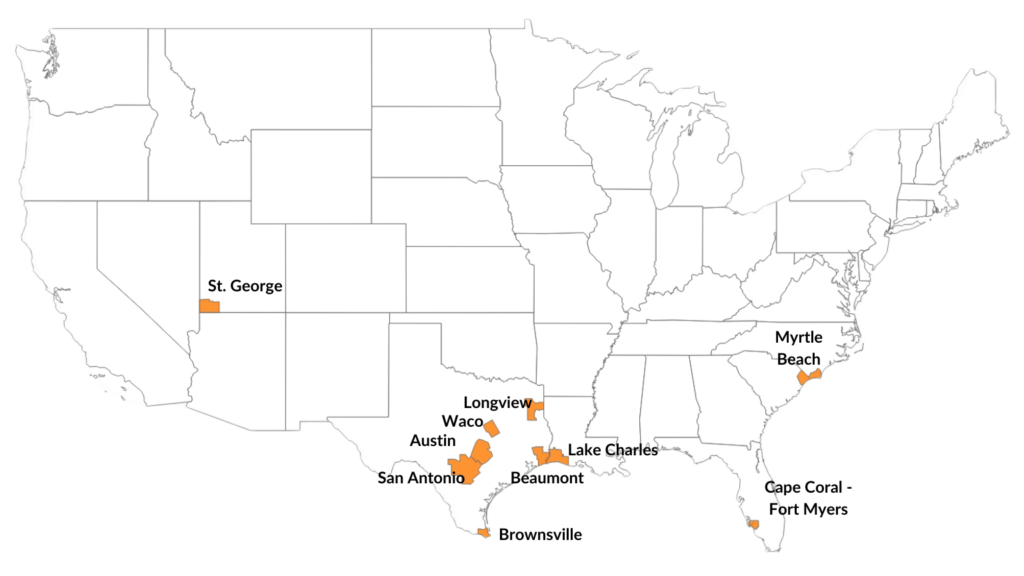
The ten weakest housing markets are expected to see modest price declines (-1.0% to -1.8%) over the next year. These markets are diverse: some face high unemployment and struggle to attract residents, while others grapple with an oversupply of new construction dampening bidding wars. Additionally, rising property damage and insurance costs due to natural disasters in some Florida metros, coupled with potential affordability concerns in areas like Austin, are deterring buyers. This interplay of local supply, demand, economic, and climate factors underscores the importance of localized housing market trends.
The 10 Least-Performing Markets Over Next 12 Months
| Rank | Metropolitan Statistical Area (MSA |
Forecast Data Q2 2024 - Q2 2025 |
|---|---|---|
| 1 | LAKE CHARLES, LA | -1.8% |
| 2 | LONGVIEW, TX | -1.7% |
| 3 | BROWNSVILLE-HARLINGEN, TX | -1.6% |
| 4 | WACO, TX | -1.4% |
| 5 | CAPE CORAL-FORT MYERS, FL | -1.4% |
| 6 | BEAUMONT-PORT ARTHUR, TX | -1.3% |
| 7 | AUSTIN-ROUND ROCK-SAN MARCOS, TX | -1.2% |
| 8 | ST. GEORGE, UT | -1.2% |
| 9 | SAN ANTONIO-NEW BRAUNFELS, TX | -1.1% |
| 10 | MYRTLE BEACH-CONWAY-NORTH MYRTLE BEACH, SC | -1.0% |
- Download the Q2 2024 – Q2 2025 VeroFORECAST results as a PDF infographic or as an infographic image.
- Download the 10 Strongest-Performing Markets graphic only.


